From meter readings
to clearer billing.
Understand what was used, how charges were calculated and how costs change over time. Bring meter data and utility billing into one connected view.
Don’t just see the bill.
Understand it.
Give facilities, property and operations teams a shared view of the readings and charges behind each billing period.
Billing at a glance
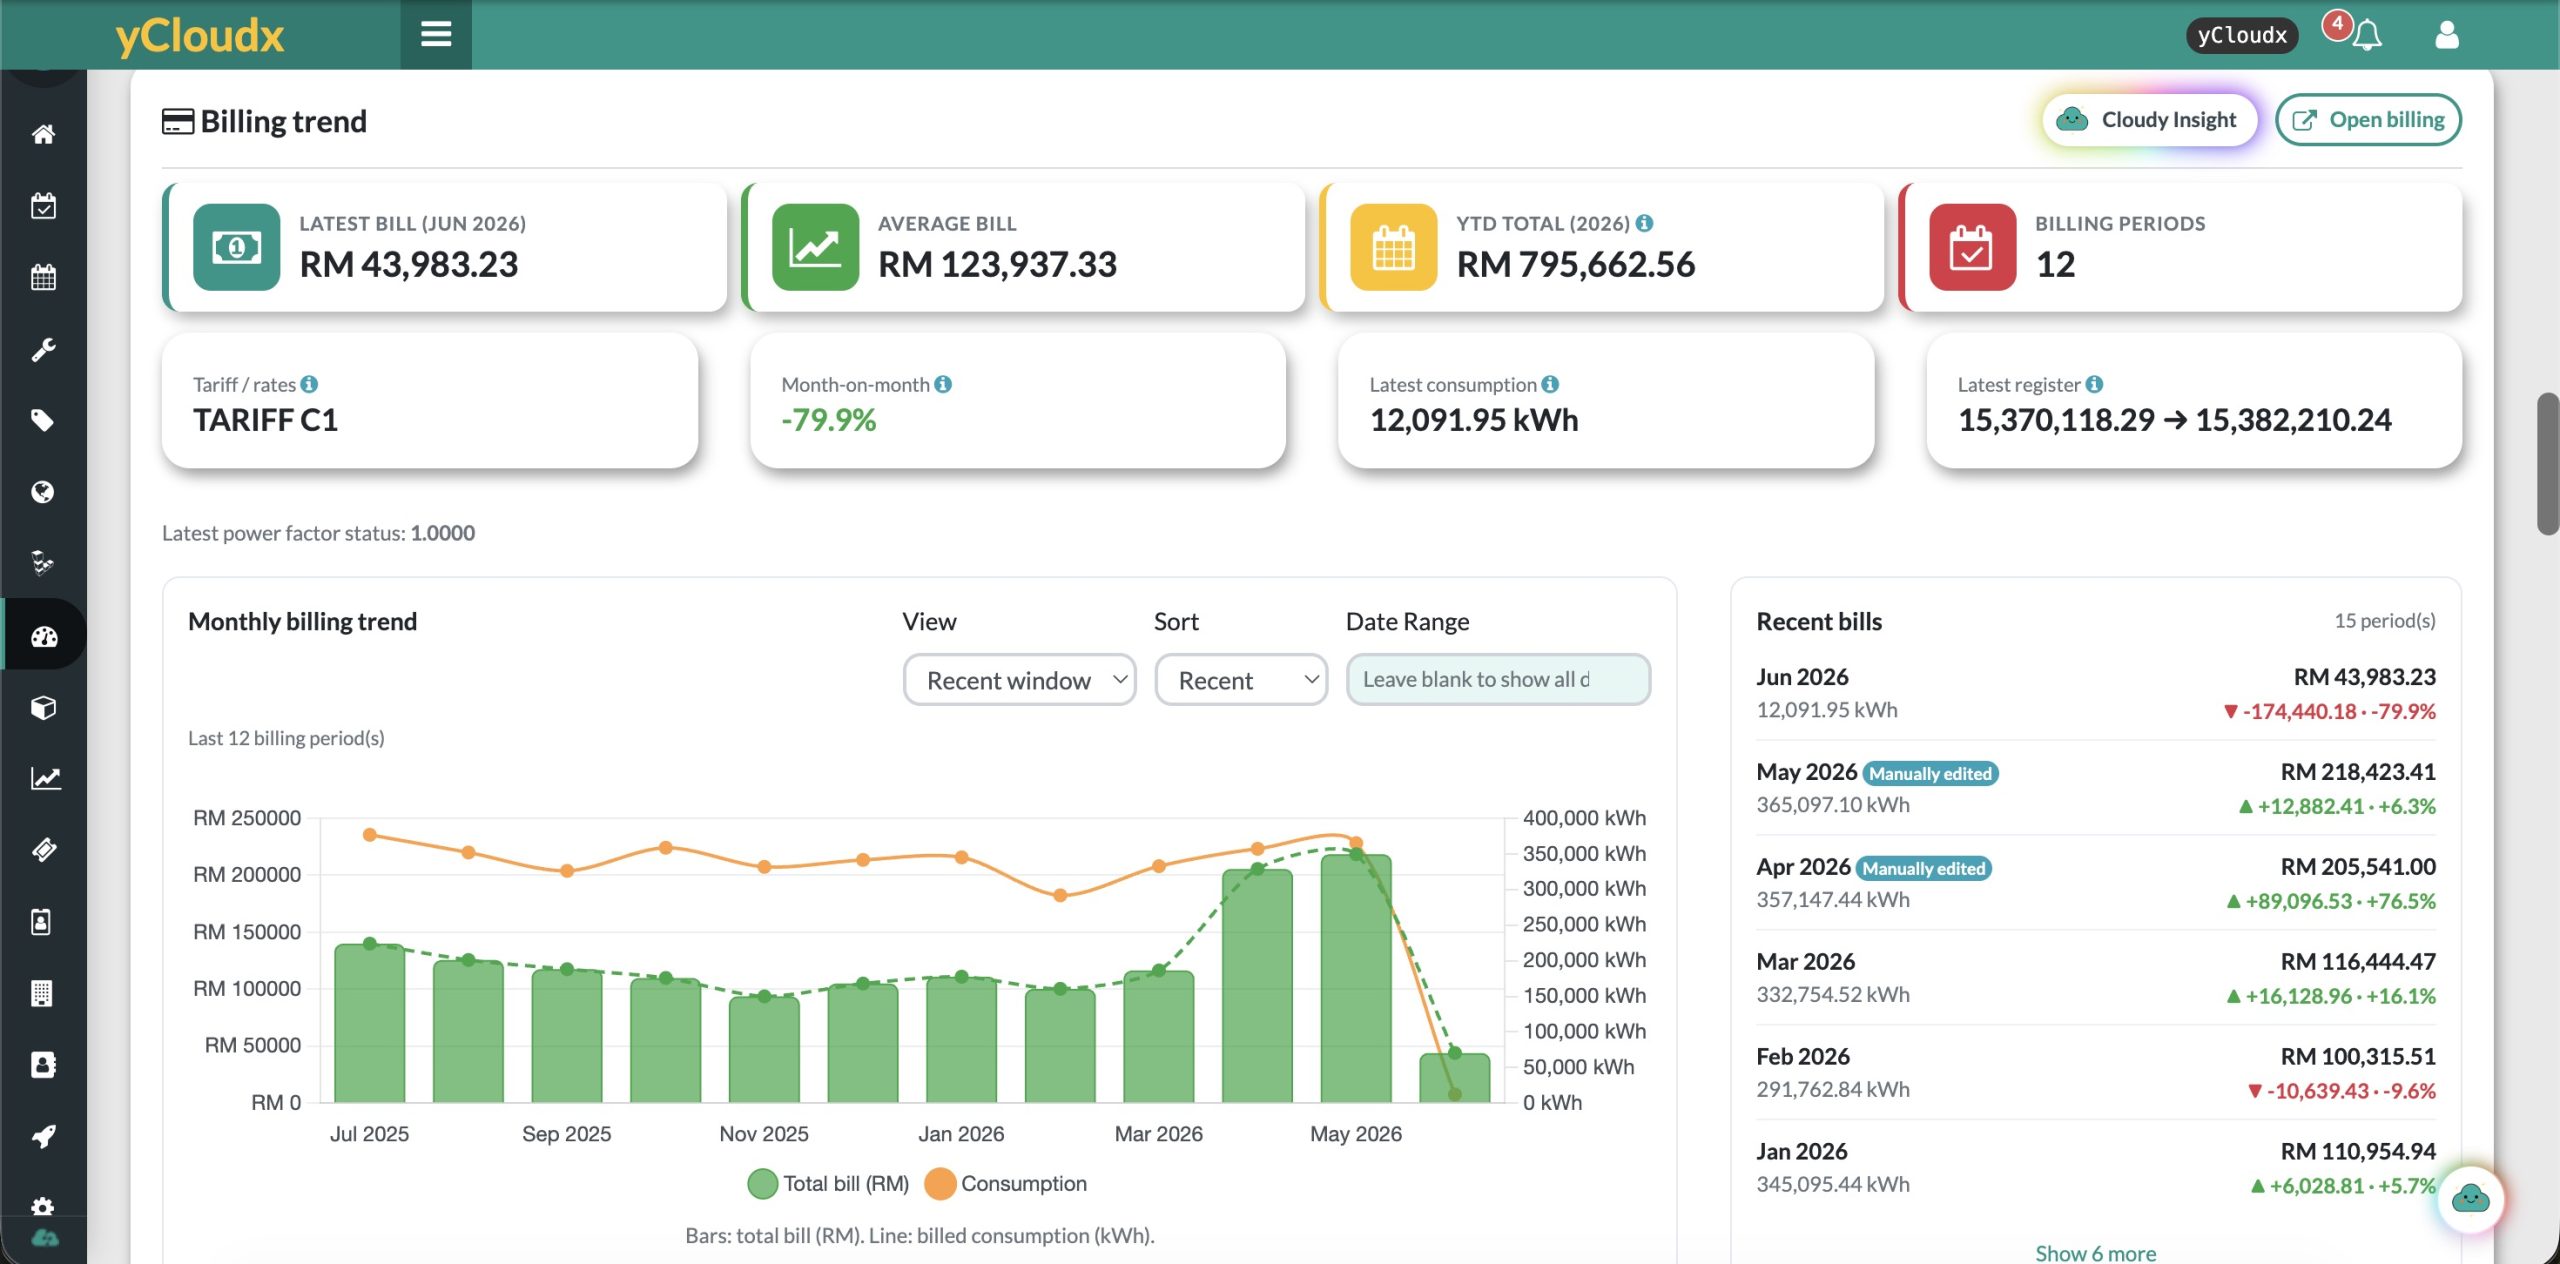
Review the latest bill, average bill, year-to-date total and billing periods from a single dashboard.
Usage alongside cost
Compare consumption with billed amounts to put changes in spending into context.
Itemised charges
Review the individual components of a bill instead of working from the final total alone.
Source readings
See previous and current readings and the underlying meter contributions used in the calculation.
Reading trends
Explore meter histories, date ranges and summary statistics to support a closer review.
Pending readings
Use the meter overview to identify reading activity that still needs attention.
Follow the numbers.
From source to summary.
A clear chain of information helps your team review a billing period and explain the result.
Review the previous and current meter values.
See the usage recorded for the billing period.
Review the configured rates and charge components.
Compare the result with other billing periods.
Illustrative review workflow. Calculations depend on the meter setup, source data and billing configuration.
A total you can
trace back.
Move from the bill total to the detail: period readings, consumption, charge components and the source meters contributing to the calculation.
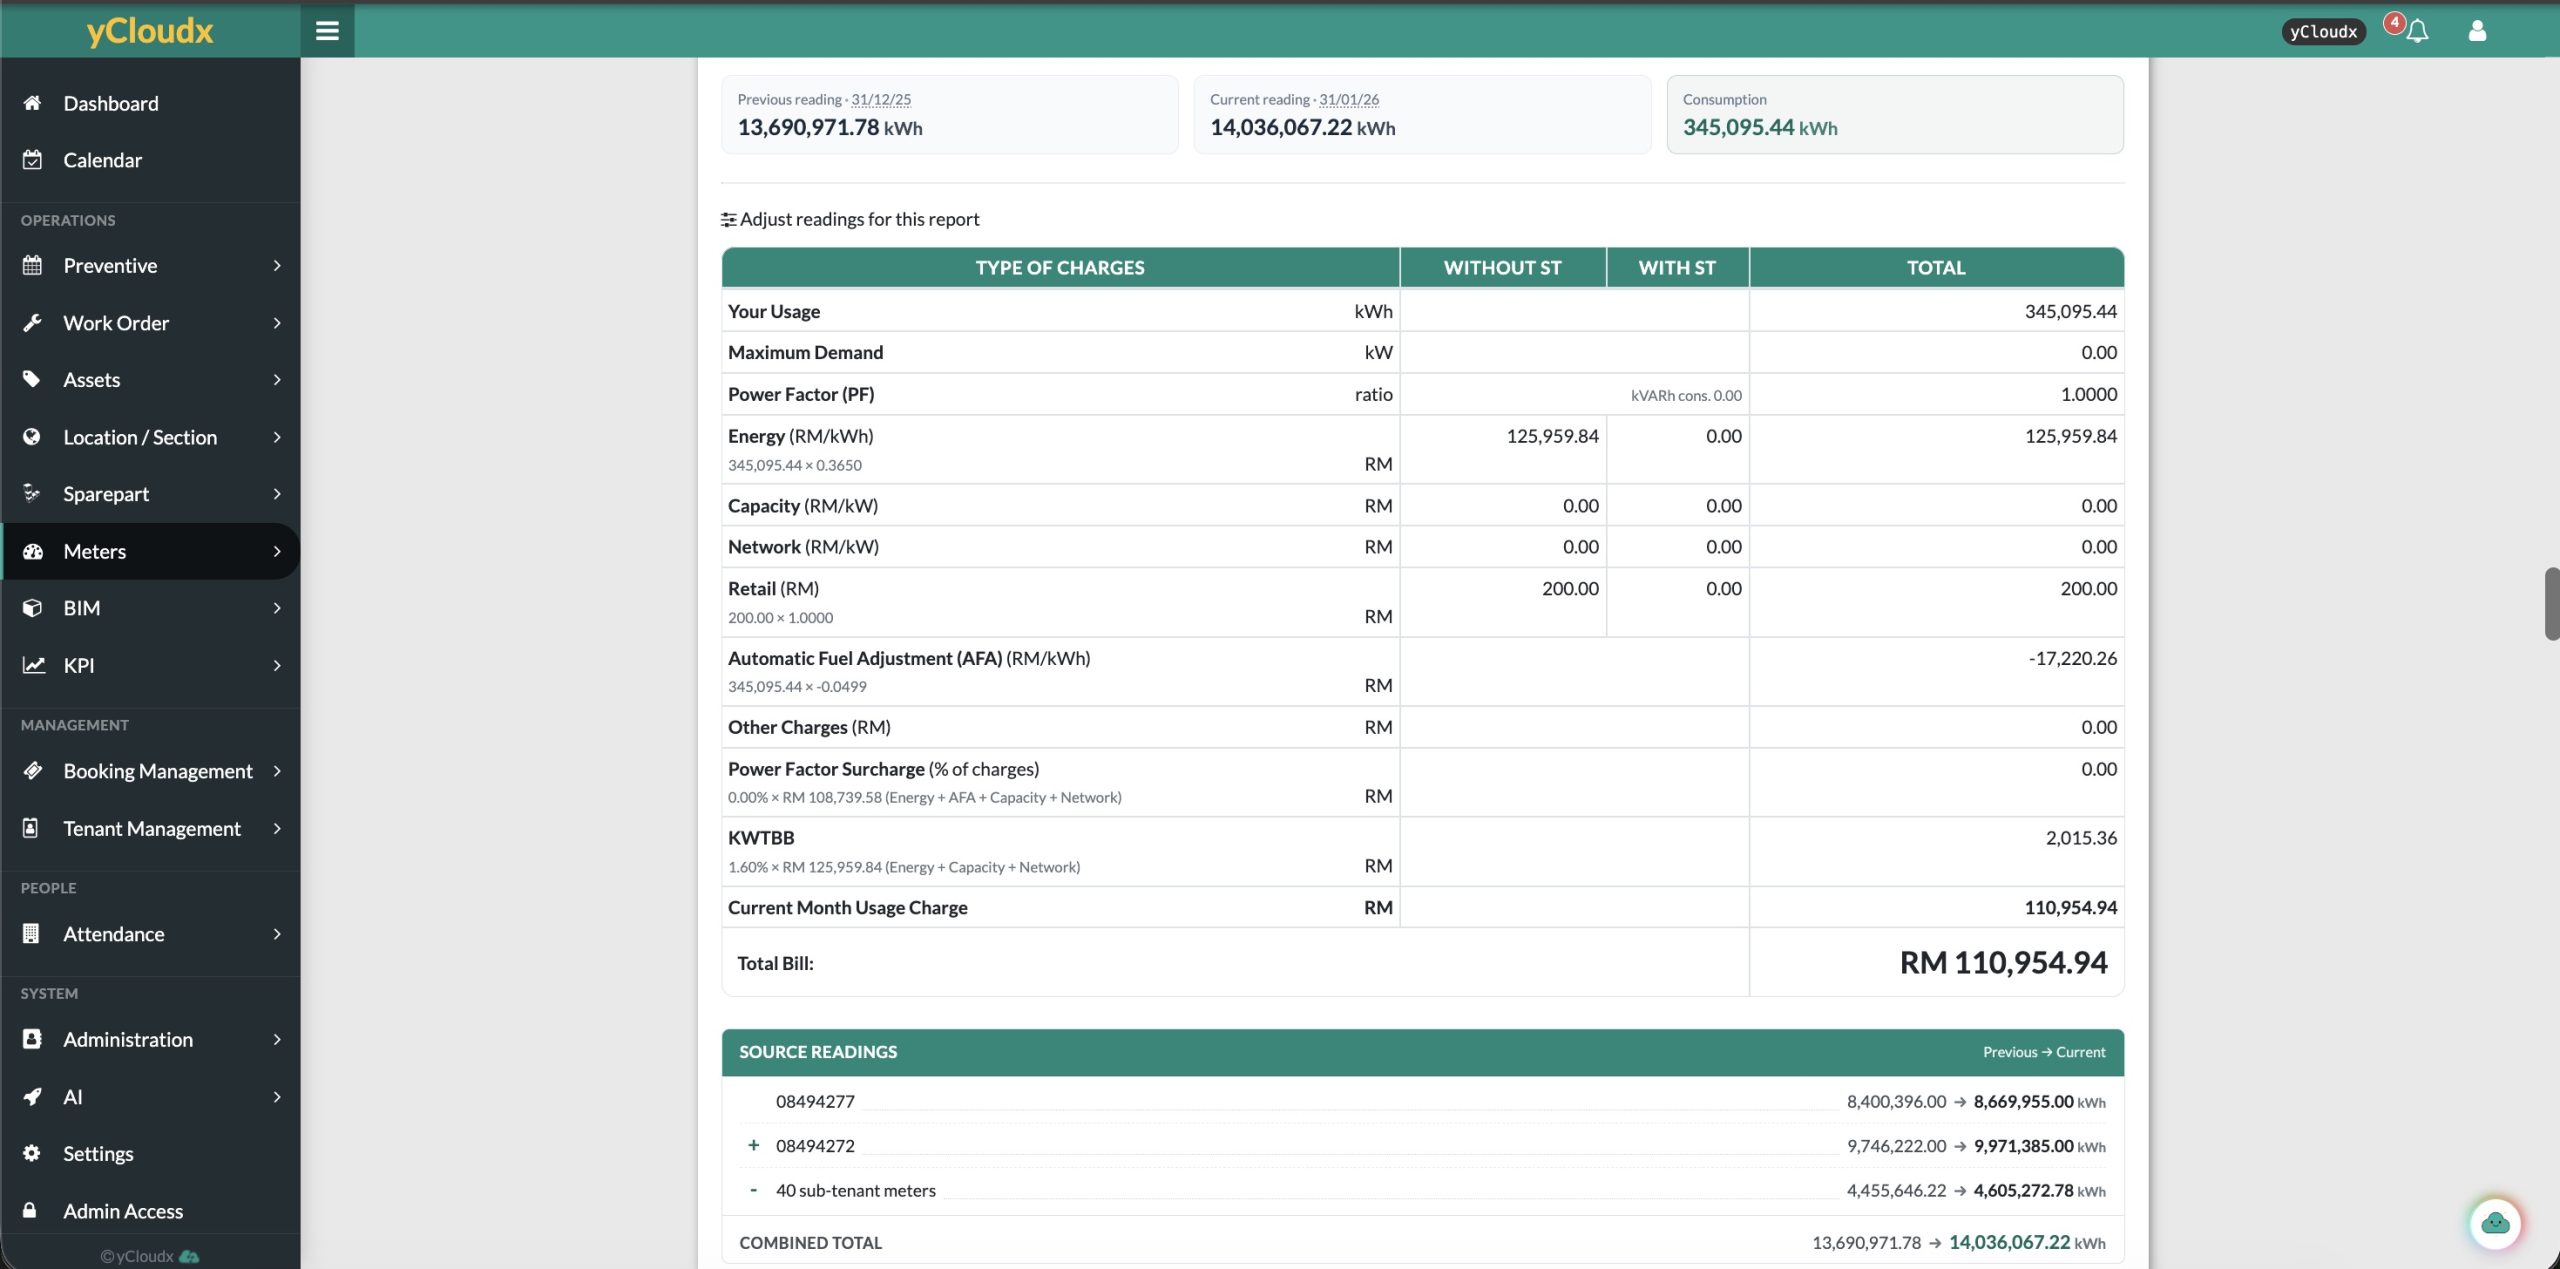
Keep the previous reading, current reading and period consumption visible together.
Review energy and other configured charges, adjustments and totals in an itemised report.
See added and deducted source readings, including the sub-tenant deduction illustrated here.
Shown values and charge labels are product-interface examples. They do not establish current utility rates, tax treatment or regulatory compliance. Validate the applicable rules for your setup.
See the pattern.
Know where to look next.
Explore reading histories over time, with date-range controls and maximum and average values. Use the trends to focus your investigation when a reading looks unusual.
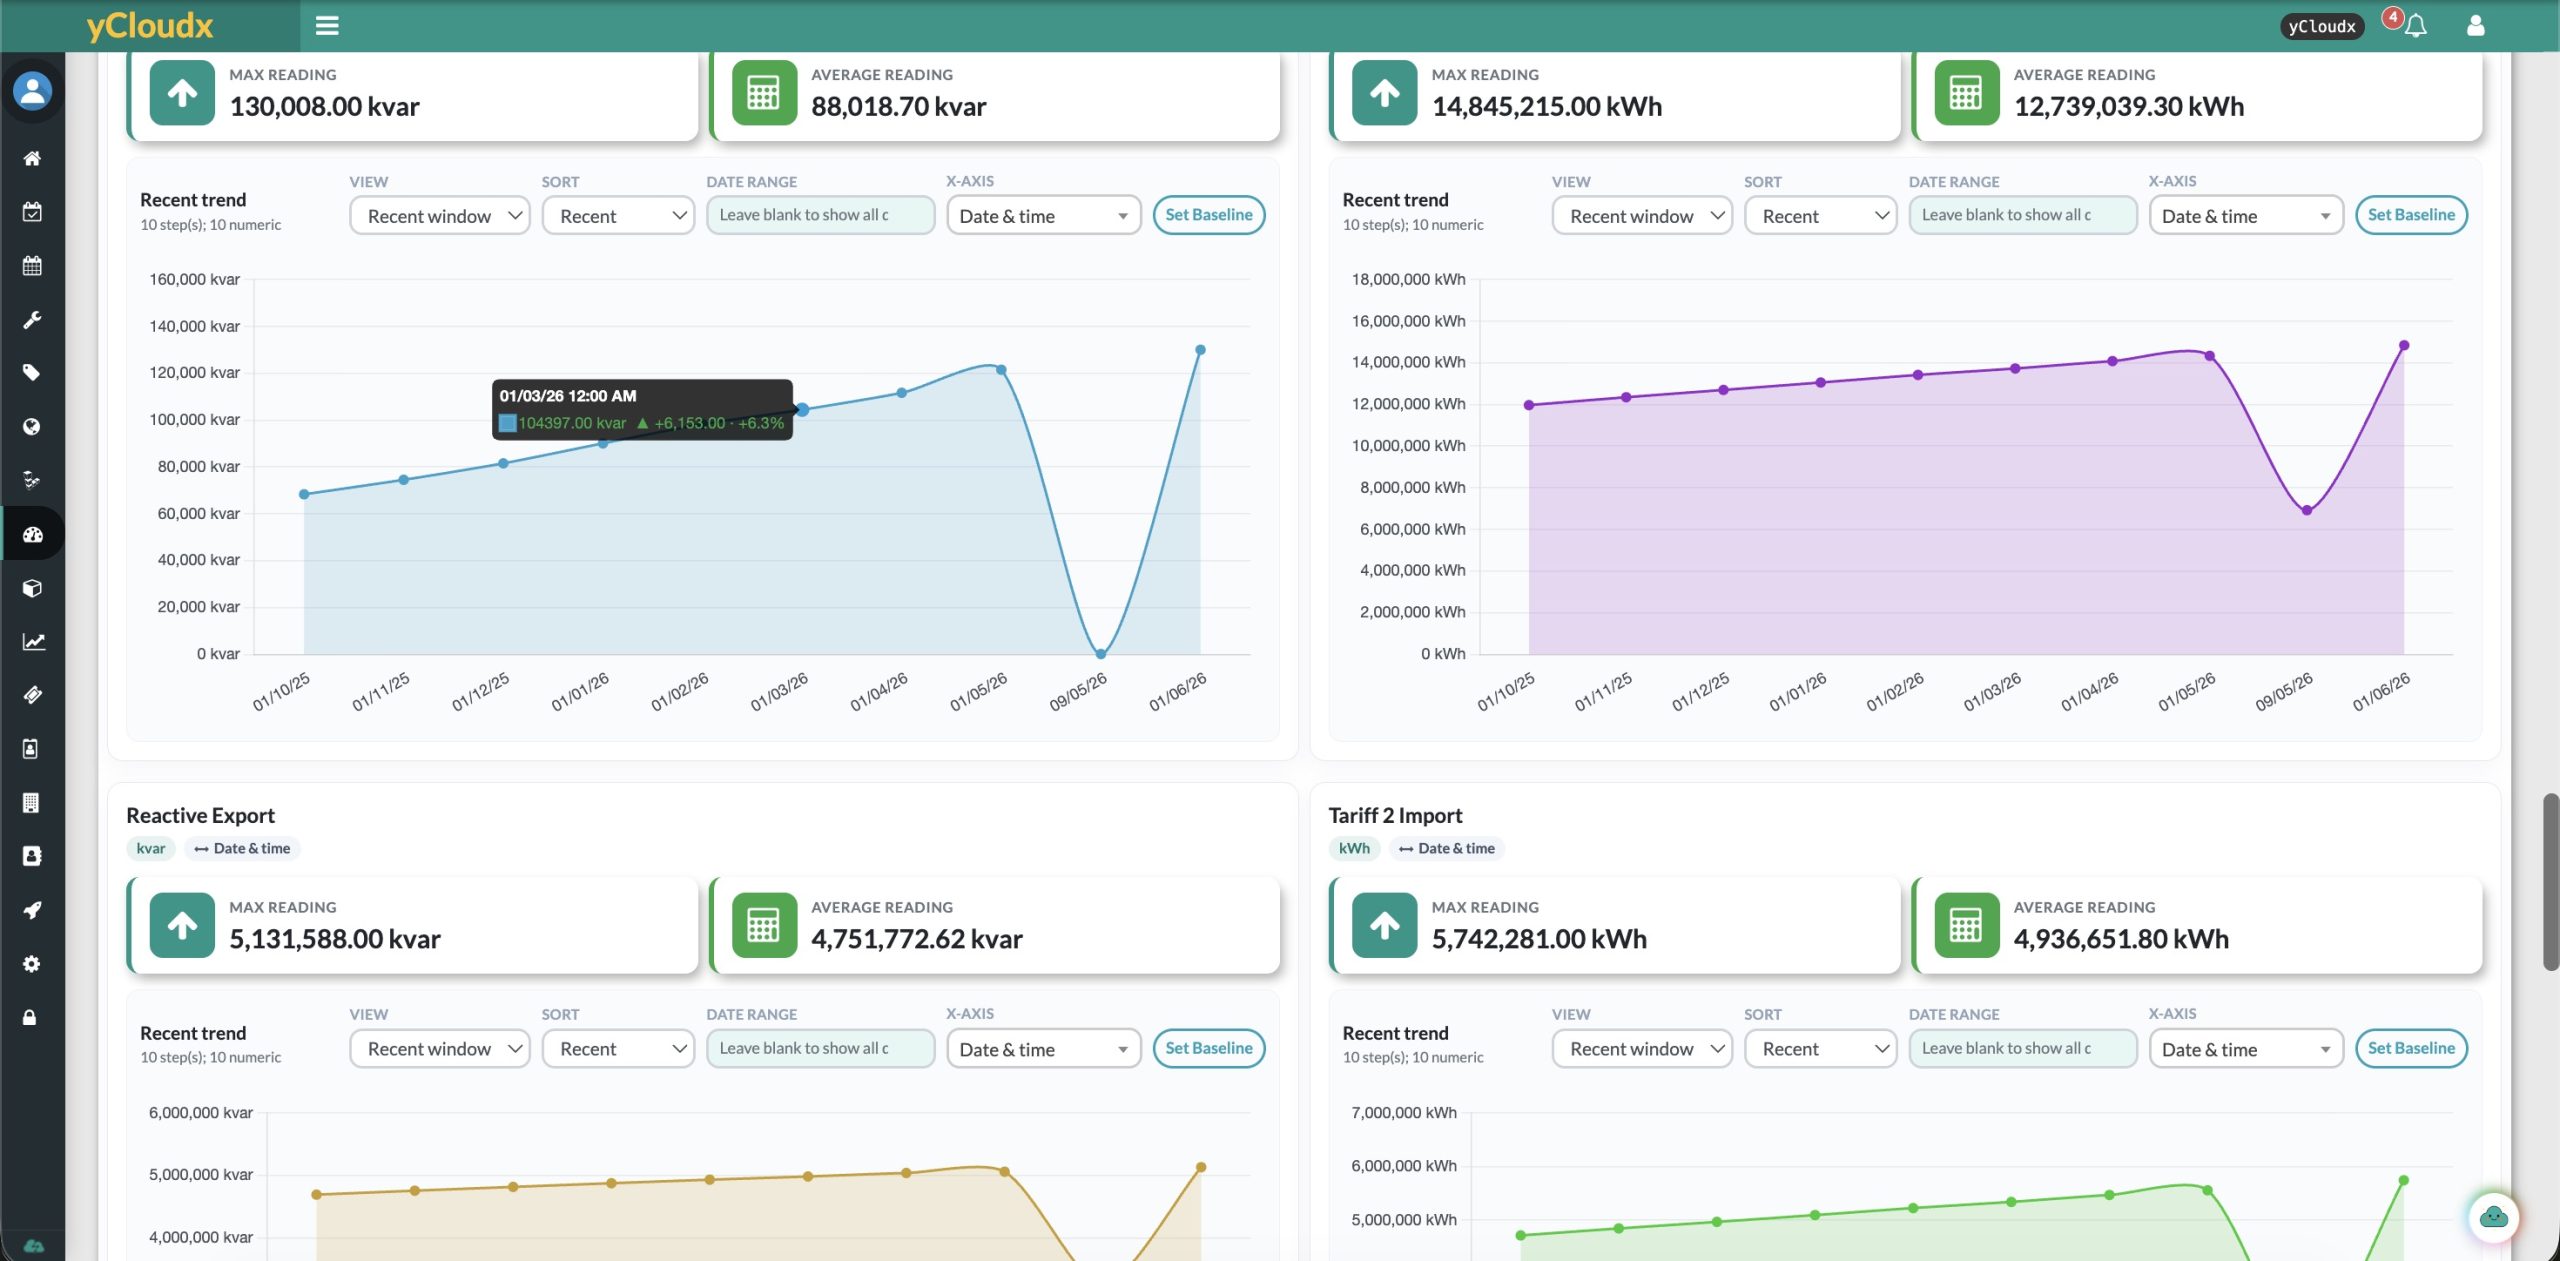
Focus the review using the available view, sorting and date-range controls.
Review the available reading series and their units without losing the time context.
Check the source records before treating a sudden change as a change in consumption.
A meter register reading and period consumption are not necessarily the same measure. Interpret each chart using its label, units and meter configuration.
Keep meter activity
within reach.
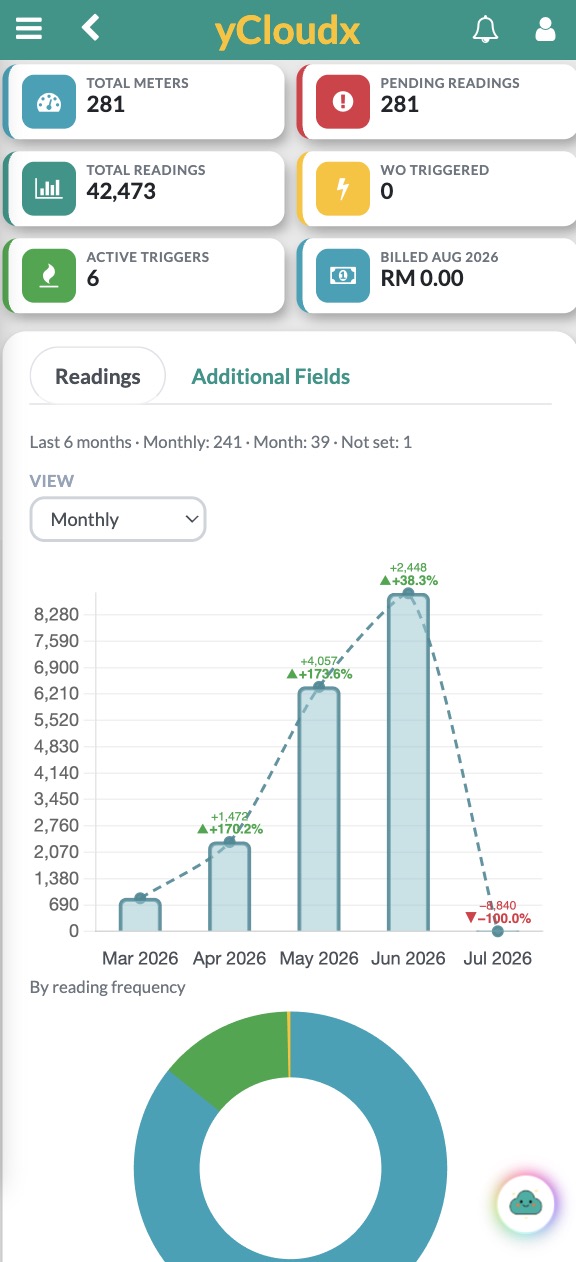
Review total meters, pending readings and recent reading activity in a compact mobile view. Keep an overview close at hand between site visits and office reviews.
Meter counts. Reading totals. Monthly trends. A focused view for checking the essentials.
Use a larger screen for detailed billing reports and side-by-side chart analysis.
Make billing reviews
more productive.
Start with the questions your team asks each month, and keep the supporting information in view.
Which readings need attention?
Review pending activity and meter histories before checking the billing period.
What contributes to this total?
Inspect source readings and the configured additions and deductions for the billing arrangement.
What changed this period?
Compare recent bills, consumption and period-on-period differences in the billing overview.
Utility billing software.
Configured for your context.
Evaluating utility billing software in Malaysia or for an international operation? Begin with your meter structure, utility type, billing rules and reporting needs.
yCloudx connects billing visibility with a wider operations platform. Explore IoT monitoring and sensor integration and CMMS and maintenance management, then discuss the modules and data connections your workflow requires.
Bring an example bill, a sample of meter readings and your allocation rules to a walkthrough. We can use that context to discuss the right configuration and confirm the scope.
Utility billing FAQs
What does yCloudx Utility Billing Management do?
It brings meter readings, consumption information and billing summaries into a connected workspace. Teams can review reading history, itemised charges and billing trends rather than looking at a bill total alone.
Can I compare consumption and billing across periods?
Yes. The illustrated billing dashboard shows monthly bill totals alongside consumption, recent bills, average billing and a year-to-date total. Date-range and sorting controls help focus the review.
Can I trace a bill back to its meter readings?
The illustrated bill breakdown includes previous and current readings, consumption and a source-readings section. This makes the readings used in the calculation visible alongside the charges.
Does it support combined and deducted meter readings?
The supplied interface shows a combined total with added source readings and a deduction for sub-tenant meters. The appropriate meter relationships and calculation rules need to be configured for your billing arrangement.
Which charges can appear in a bill breakdown?
The example electricity report displays energy, capacity, network, retail, fuel adjustment and other charge rows. Available charges and their values depend on your configuration, readings and applicable rates. The screenshot is an interface example, not current tariff guidance.
Can teams review meters on mobile?
Yes. The supplied mobile dashboard shows meter totals, pending readings, reading history and trends. A larger screen is useful when reviewing detailed charge breakdowns and several charts together.
Is this an accounting system or an e-Invoice service?
This page covers meter-based utility billing and reporting. If you need accounting integration, payment collection, statutory e-Invoice submission or other financial workflows, ask our team to confirm the required scope and availability.
Can yCloudx support billing requirements in Malaysia and overseas?
Discuss your utility type, meter structure, billing rules, currency and reporting requirements with the yCloudx team. A demonstration using your billing scenario is the best way to assess fit; rates and local requirements must be validated for each setup.
See the readings.
Understand the charges.
Explore how yCloudx can bring your meter data, billing detail and monthly review into focus.