01 / TIME
Availability
Review operating time against planned production time to understand the impact of recorded downtime.

Connect production records with availability, performance and quality. Give production, engineering and maintenance teams a shared view of machine output, downtime and the areas that need attention.
Request a Demo →Built in Malaysia · Product and machine context · Production reporting
OEE helps teams distinguish lost production time, reduced operating speed and rejected output. Review the underlying factors—not just the headline percentage.
Review operating time against planned production time to understand the impact of recorded downtime.
Compare production output and operating time with the configured ideal production rate.
Compare good output with total production to make rejects and quality losses visible.
Reliable metrics start with reliable inputs. Agree the ideal rate, units, production window and downtime treatment before comparing products or machines.
Define the product, SKU, category, unit and ideal production rate. Link relevant machines or assets, then capture the production date, total output, rejects and reject reason.
Record start and end times with the production timer, and retain order numbers, batch references and remarks for a more useful operational record.
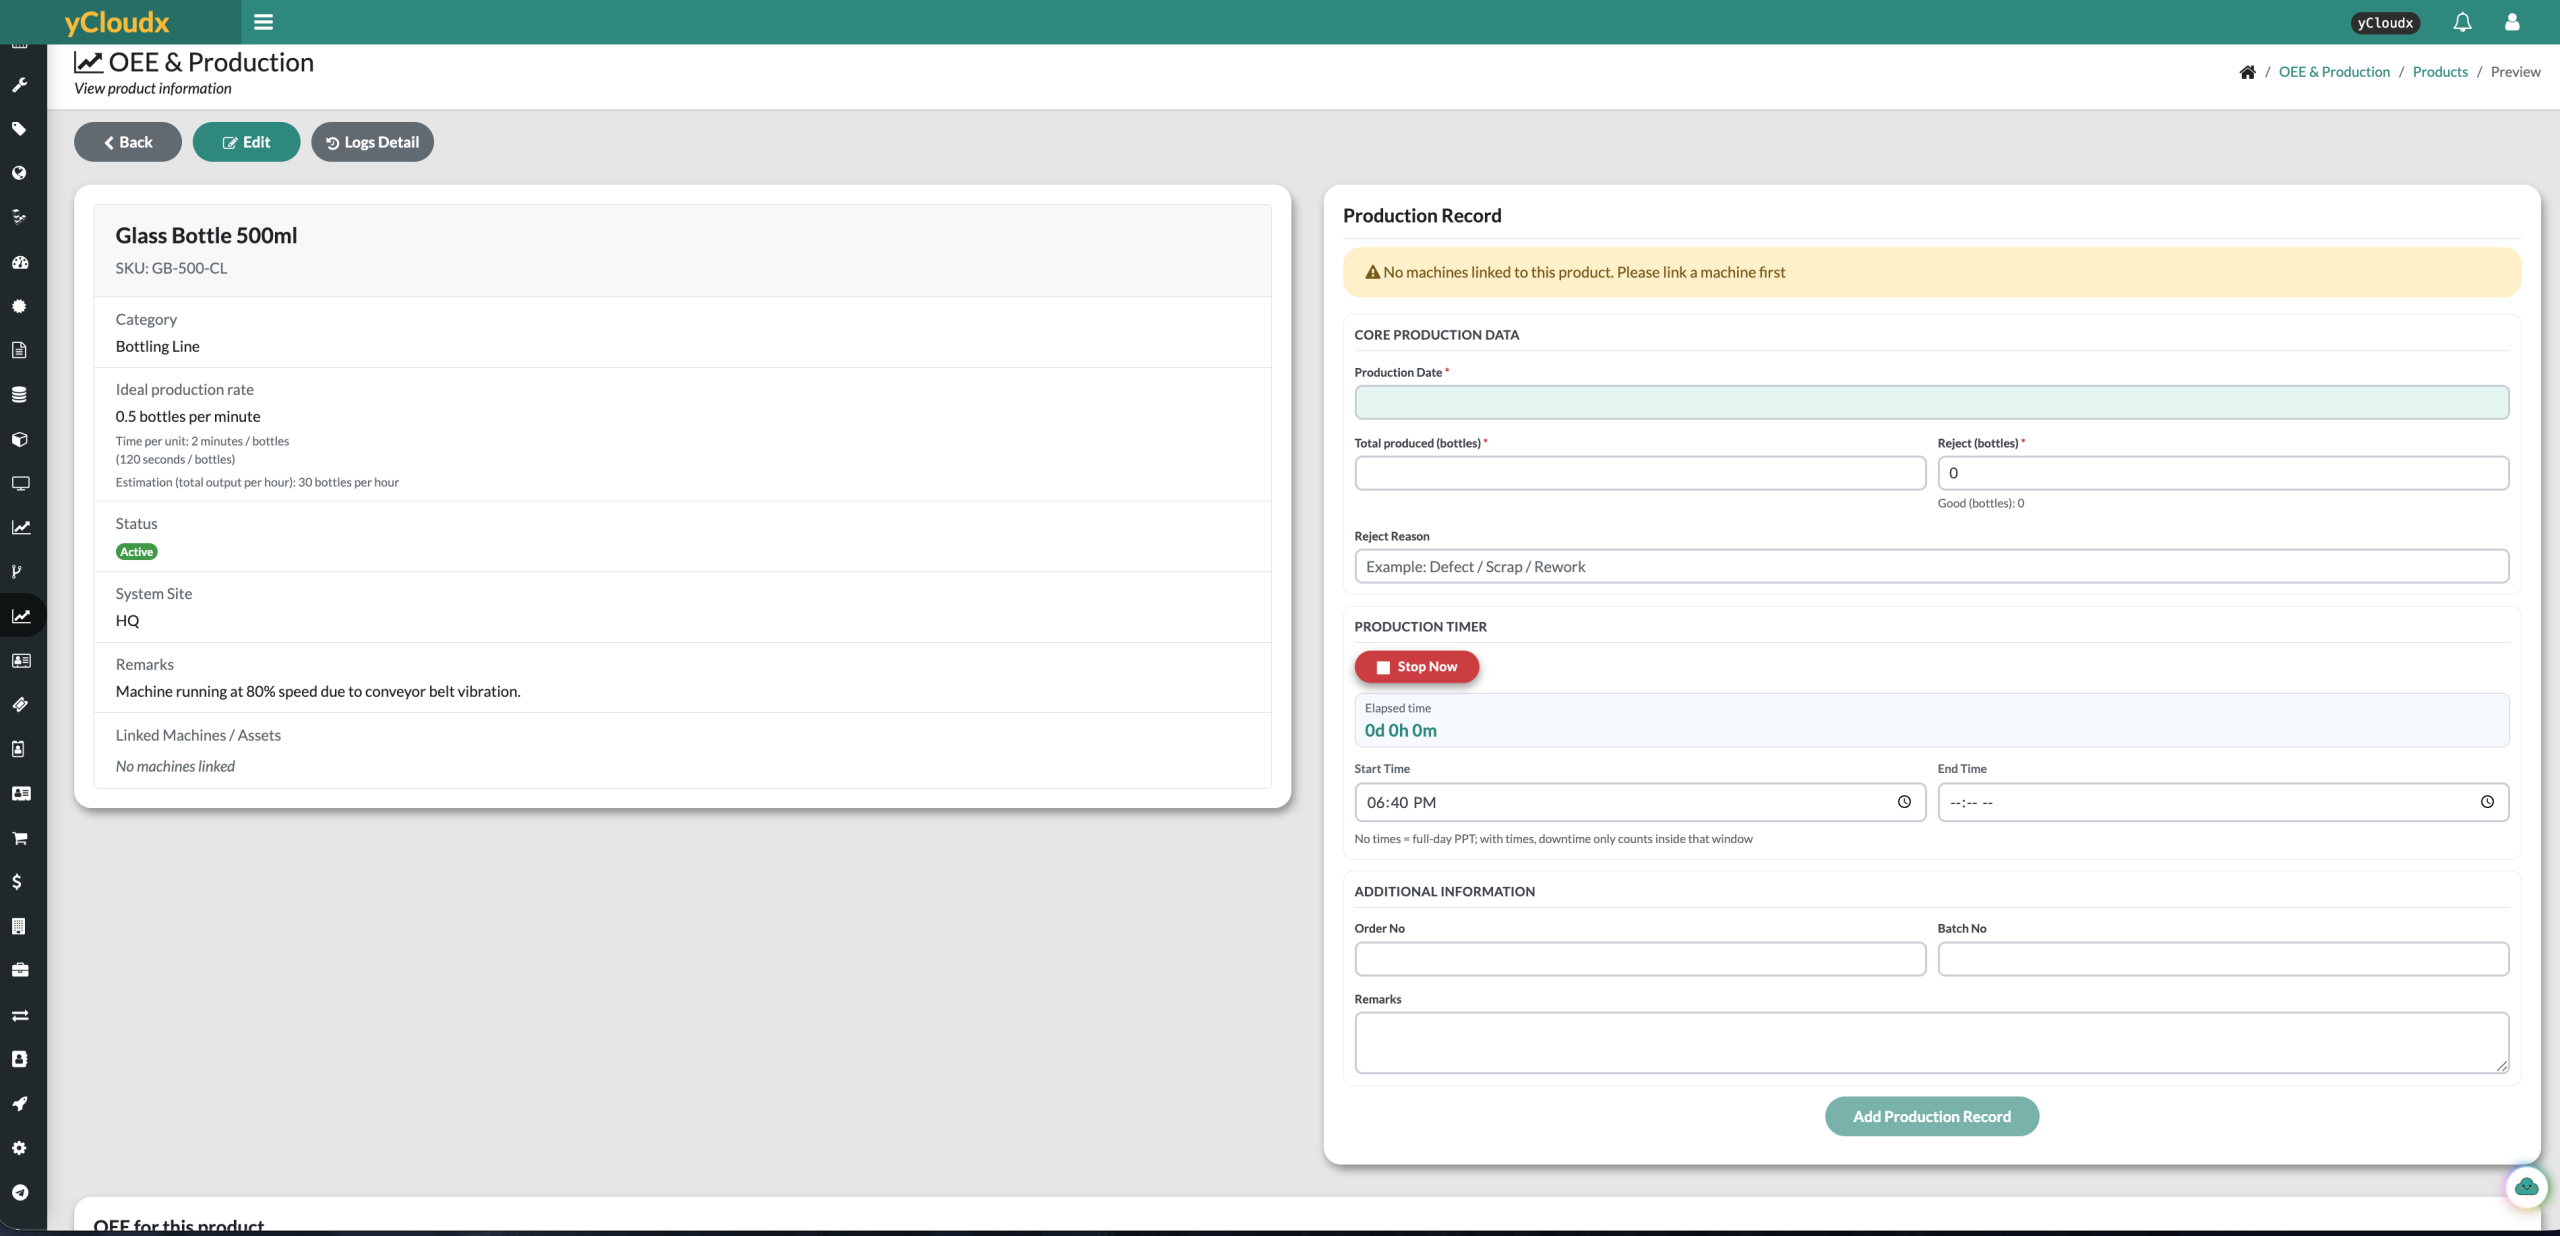
Set the product, linked machine and ideal rate.
Enter production timing, total output and rejects.
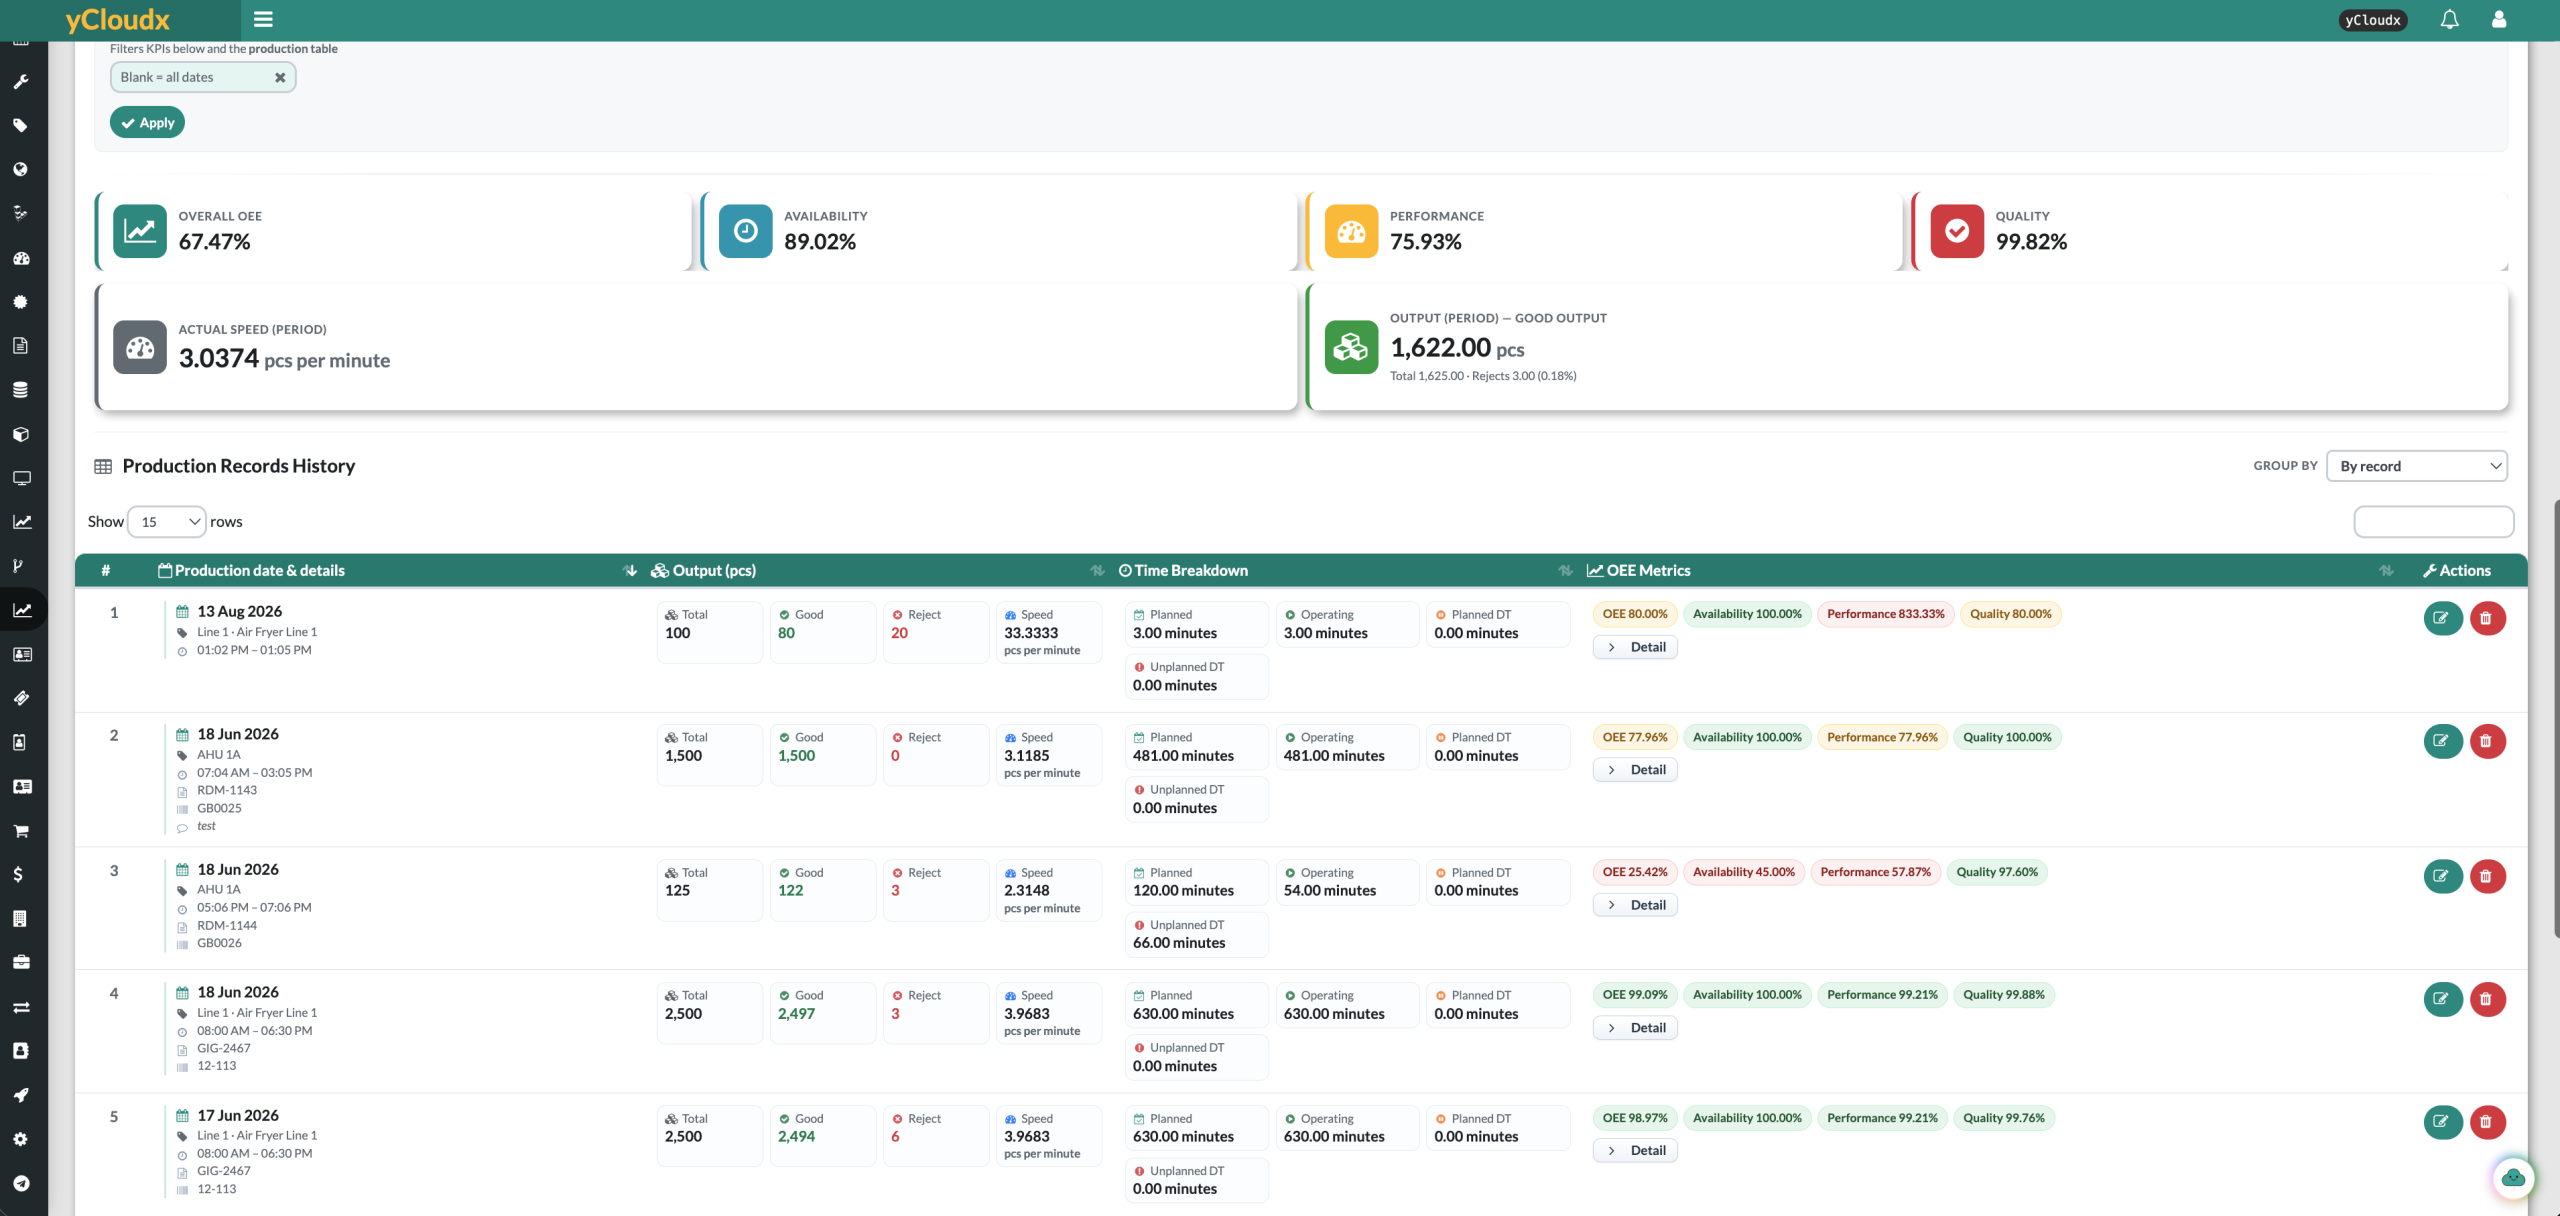
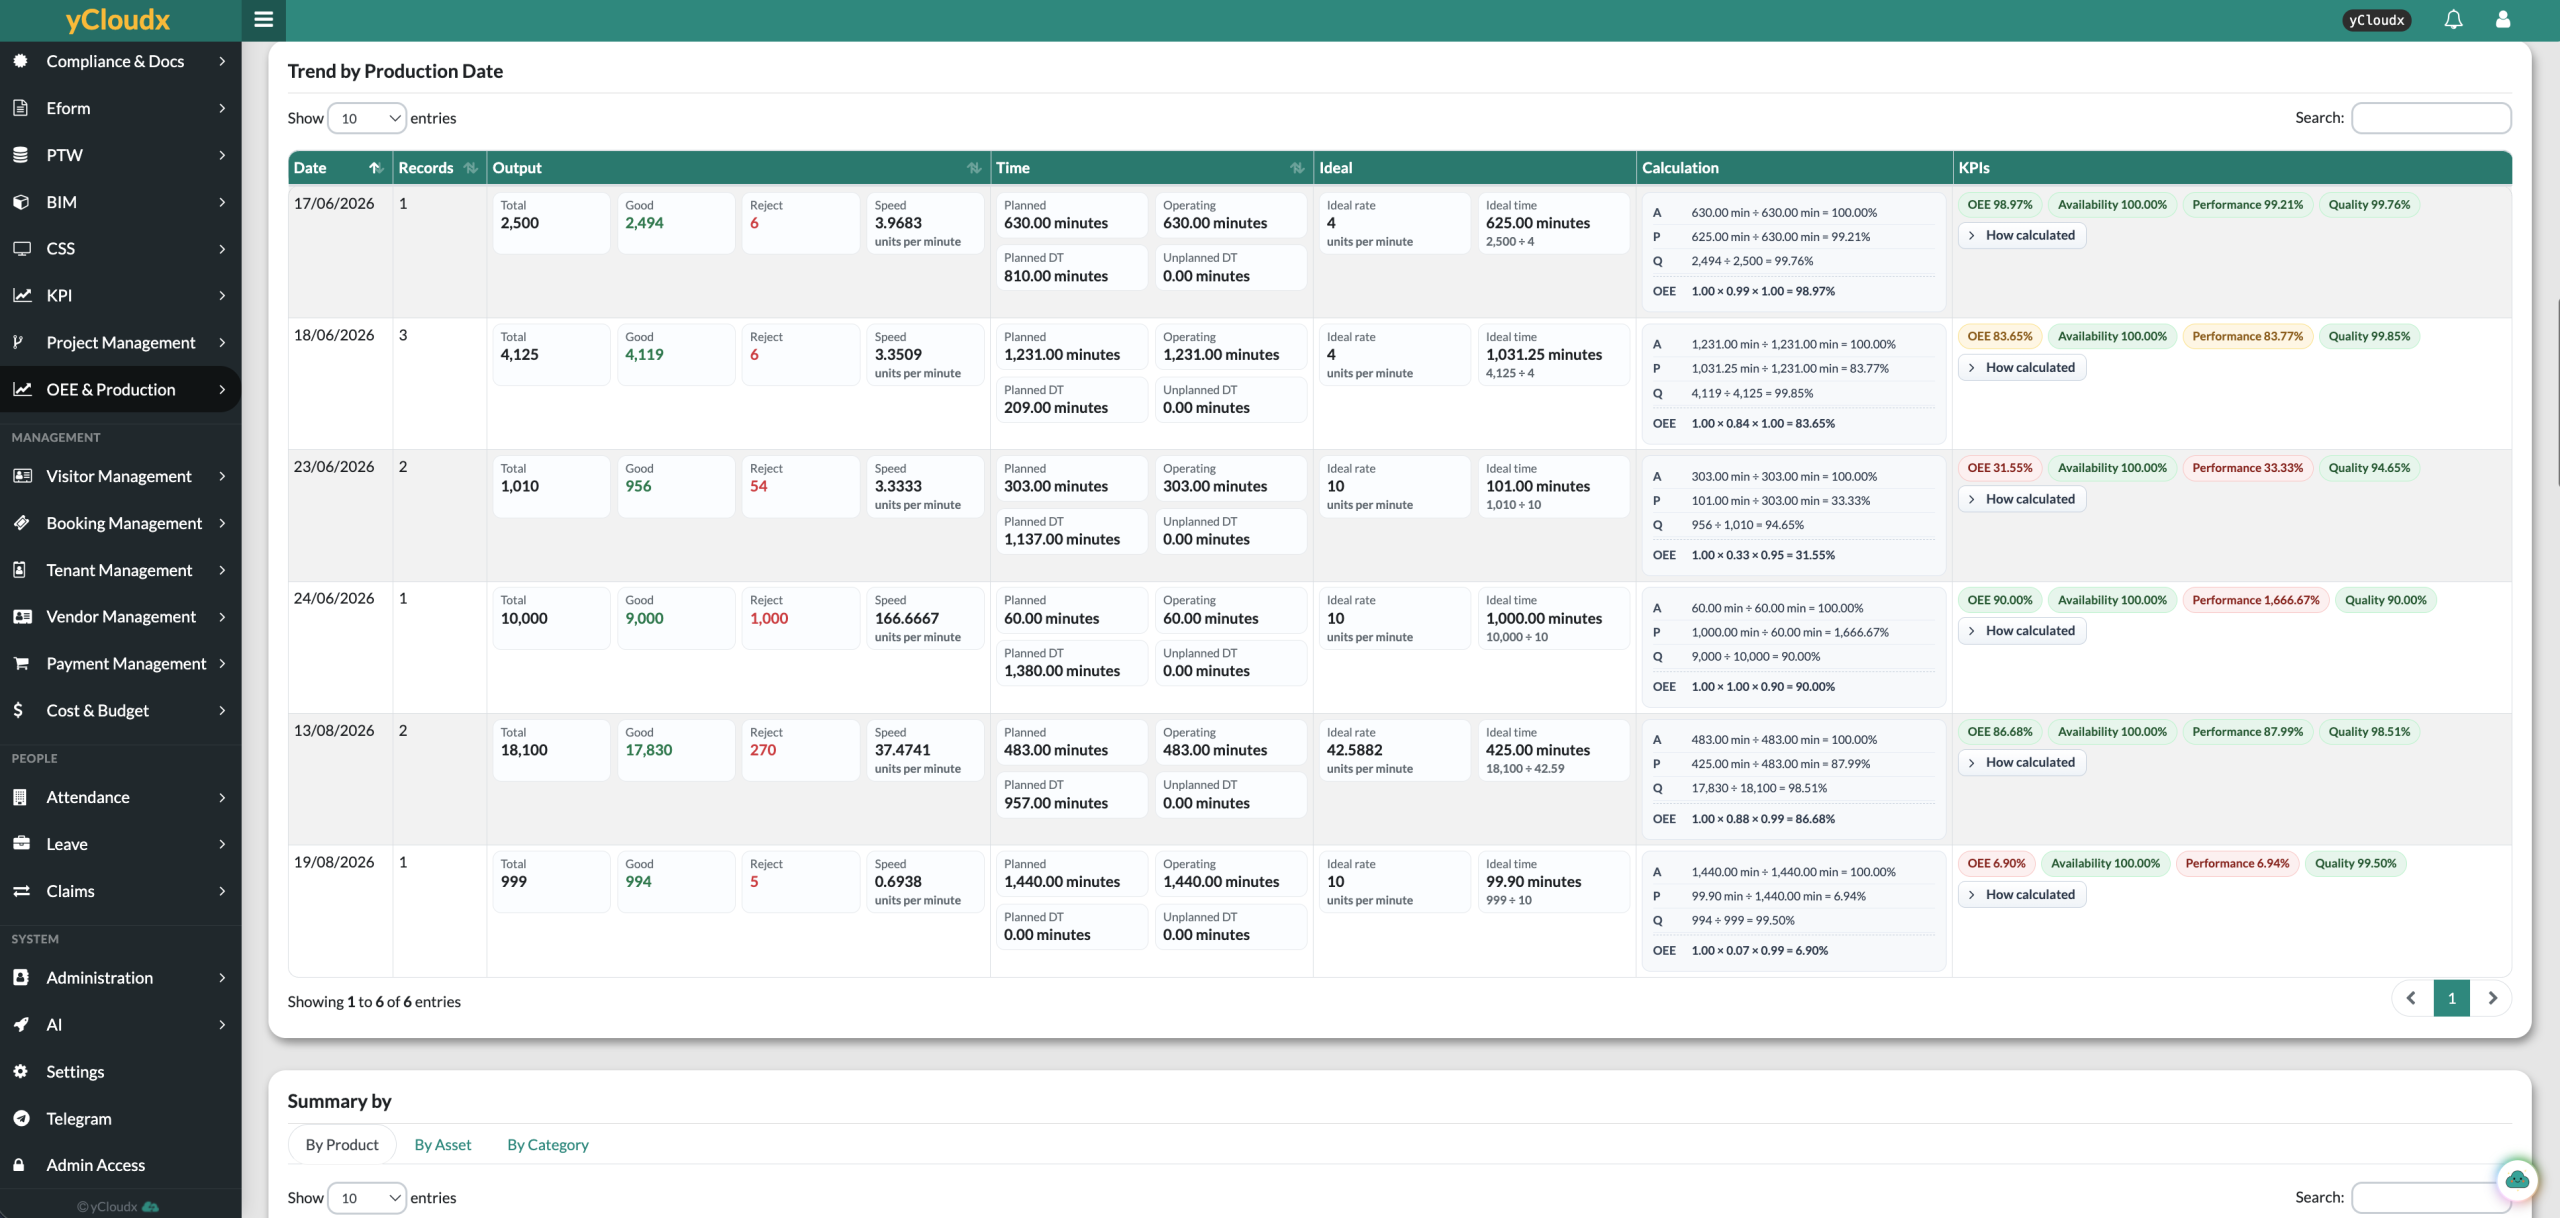
Inspect OEE factors and the underlying time breakdown.
Use the findings to guide investigation and follow-up.
Review production events with total, good and rejected output, actual speed, planned and operating time, and planned or unplanned downtime. Keep date, machine, order and batch context alongside the OEE factors.
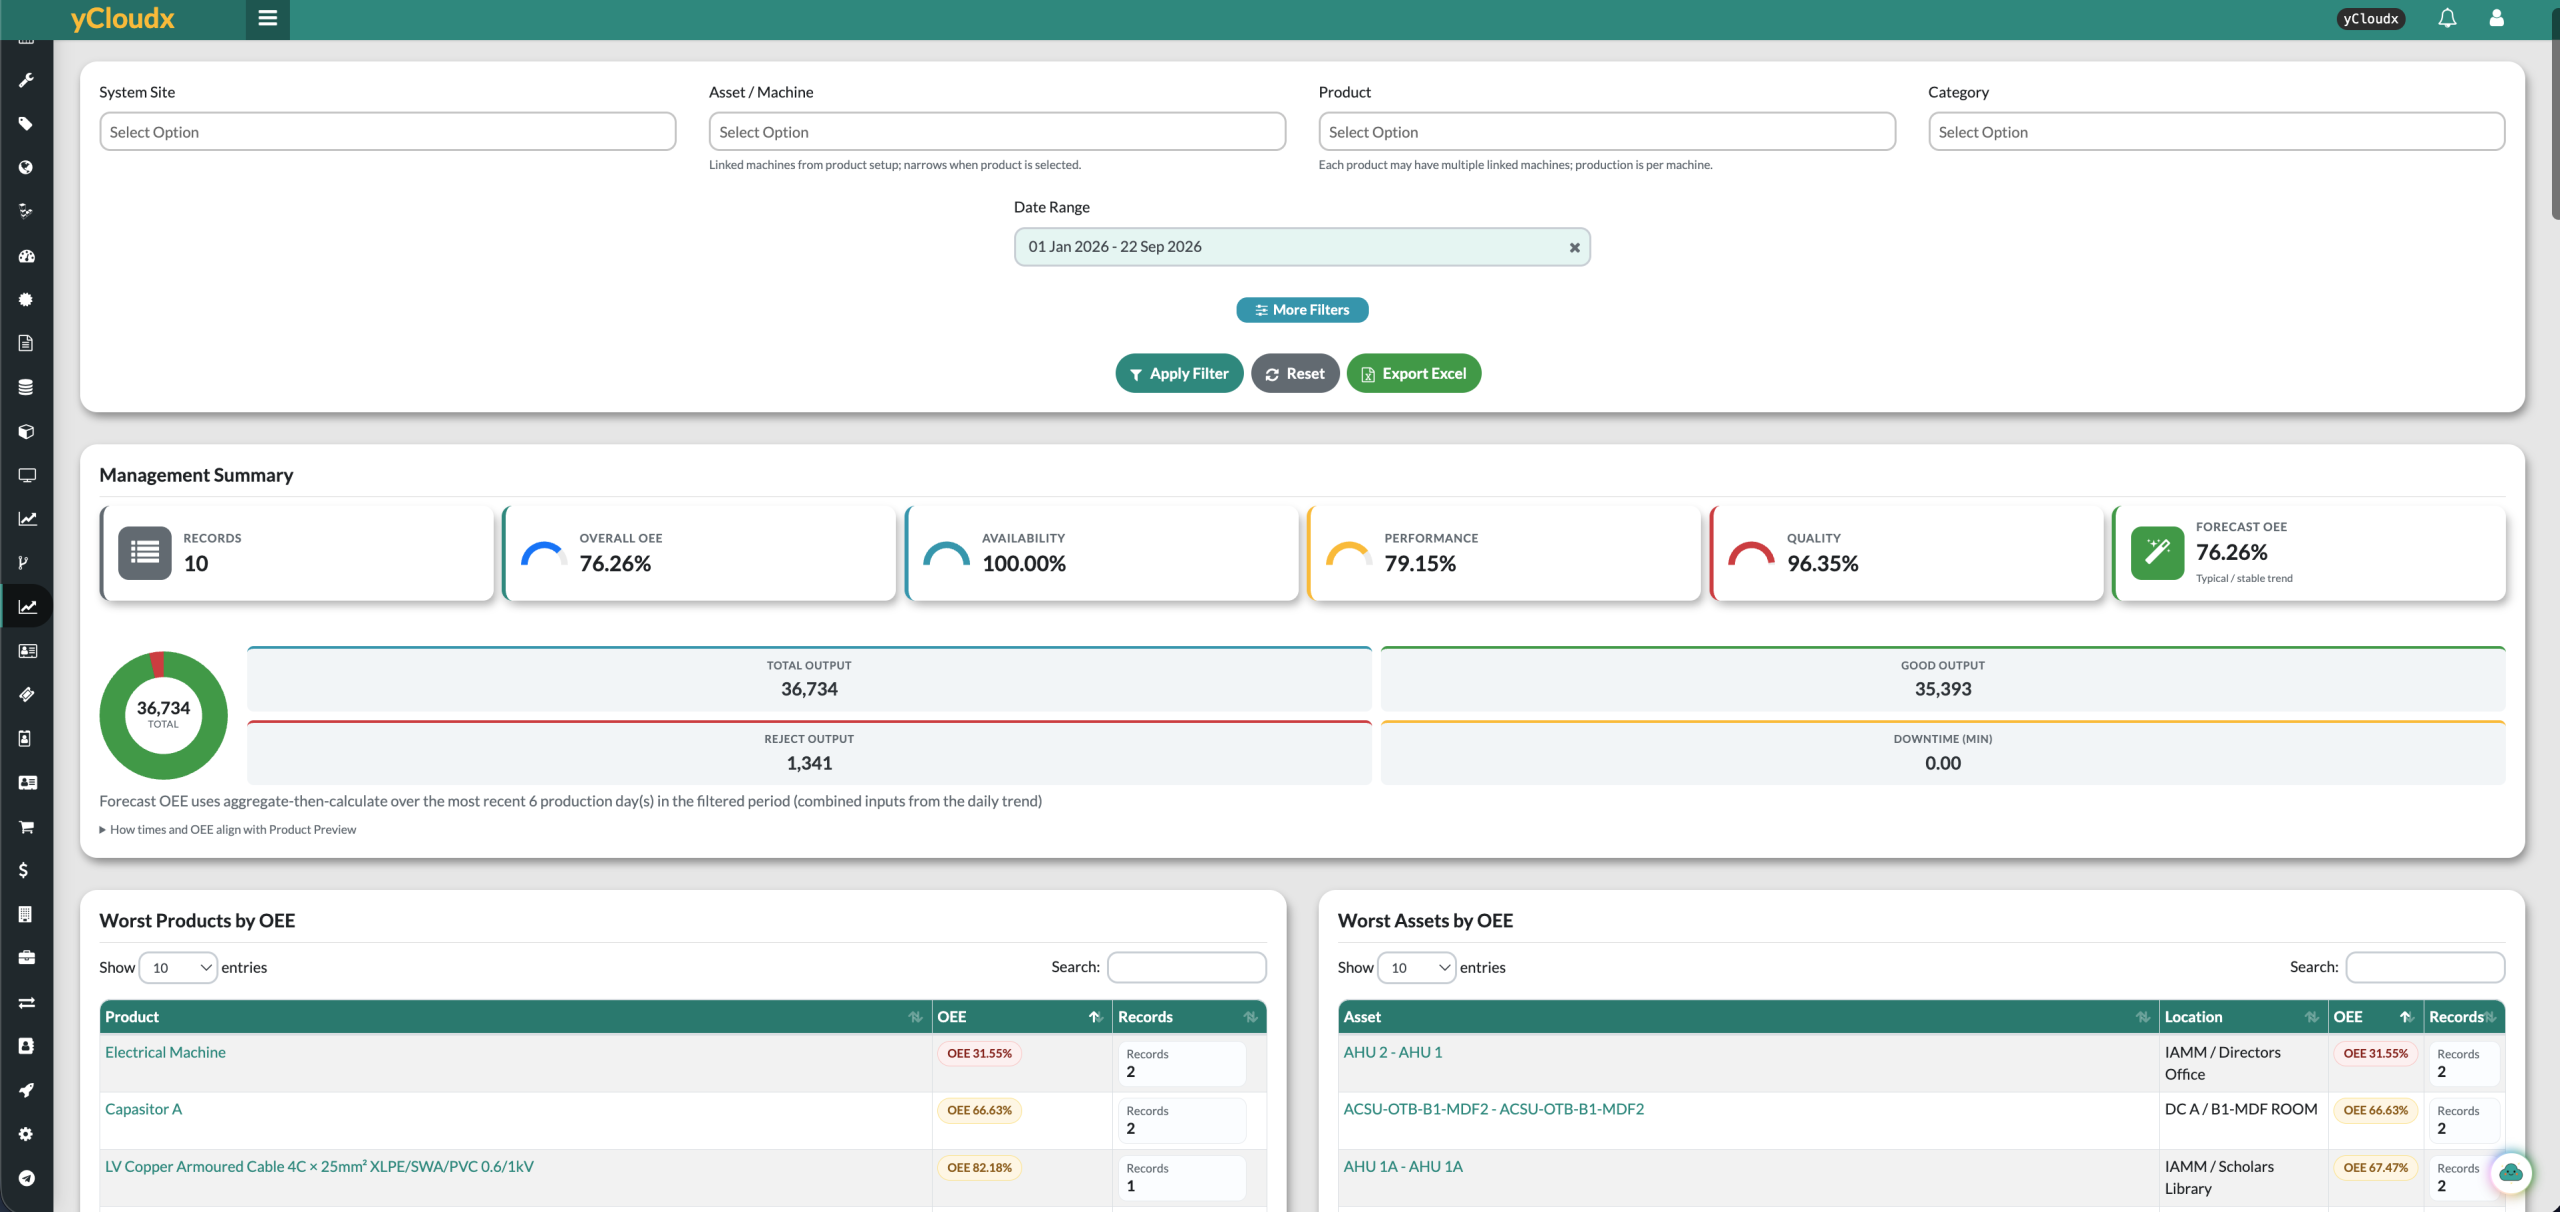
Filter reports by site, machine, product, category and date range. Review daily trends, compare products and assets, and export reports to Excel for further analysis.
See overall OEE, its three factors, output and downtime together. Lower-performing product and asset views help teams identify where to investigate.
The illustrated Forecast OEE uses combined inputs from recent production days in the selected period. Treat it as a reference for review—not a guarantee of future production.
OEE shows where to look. Maintenance and asset records help teams investigate the operational context and plan an appropriate response.
Review equipment issues alongside your work-order processes.
CMMS & Maintenance →Keep the machine connected to its asset information and service history.
Asset Management (EAM) →Use reviewed findings to inform maintenance planning and follow-up.
Preventive Maintenance →Need automated machine data? Discuss IoT integration. Data collection and system integration depend on available interfaces and the agreed implementation scope.
Overall Equipment Effectiveness (OEE) brings availability, performance and quality together to help teams understand production losses. It is commonly expressed as Availability × Performance × Quality, using the factors as ratios.
The module records production dates, products, linked machines, total output, rejects, production timing and supporting details. Reports bring together OEE factors, output and downtime for review.
Yes. Reports can be filtered by system site, asset or machine, product, category and date range, with summaries and lower-performing product and asset views.
Yes. The production form includes order number, batch number, reject reason and remarks alongside output and timing information.
The illustrated report calculates a recent-history estimate from combined inputs across the most recent production days in the selected period. It is a planning reference, not a guaranteed future result. Data quality and the chosen period affect the result.
Not by default. yCloudx OEE & Production focuses on production records, OEE visibility and operational review alongside maintenance and assets. Wider ERP, MES or machine-data requirements should be assessed separately.
Discuss your machine interfaces and data requirements with the team. Any automated collection depends on compatible interfaces, an agreed integration scope and configuration; the screenshots show the supported production-record workflow.
Bring a typical product, machine and production report. We’ll show how yCloudx can support your OEE review.
Request a Demo →